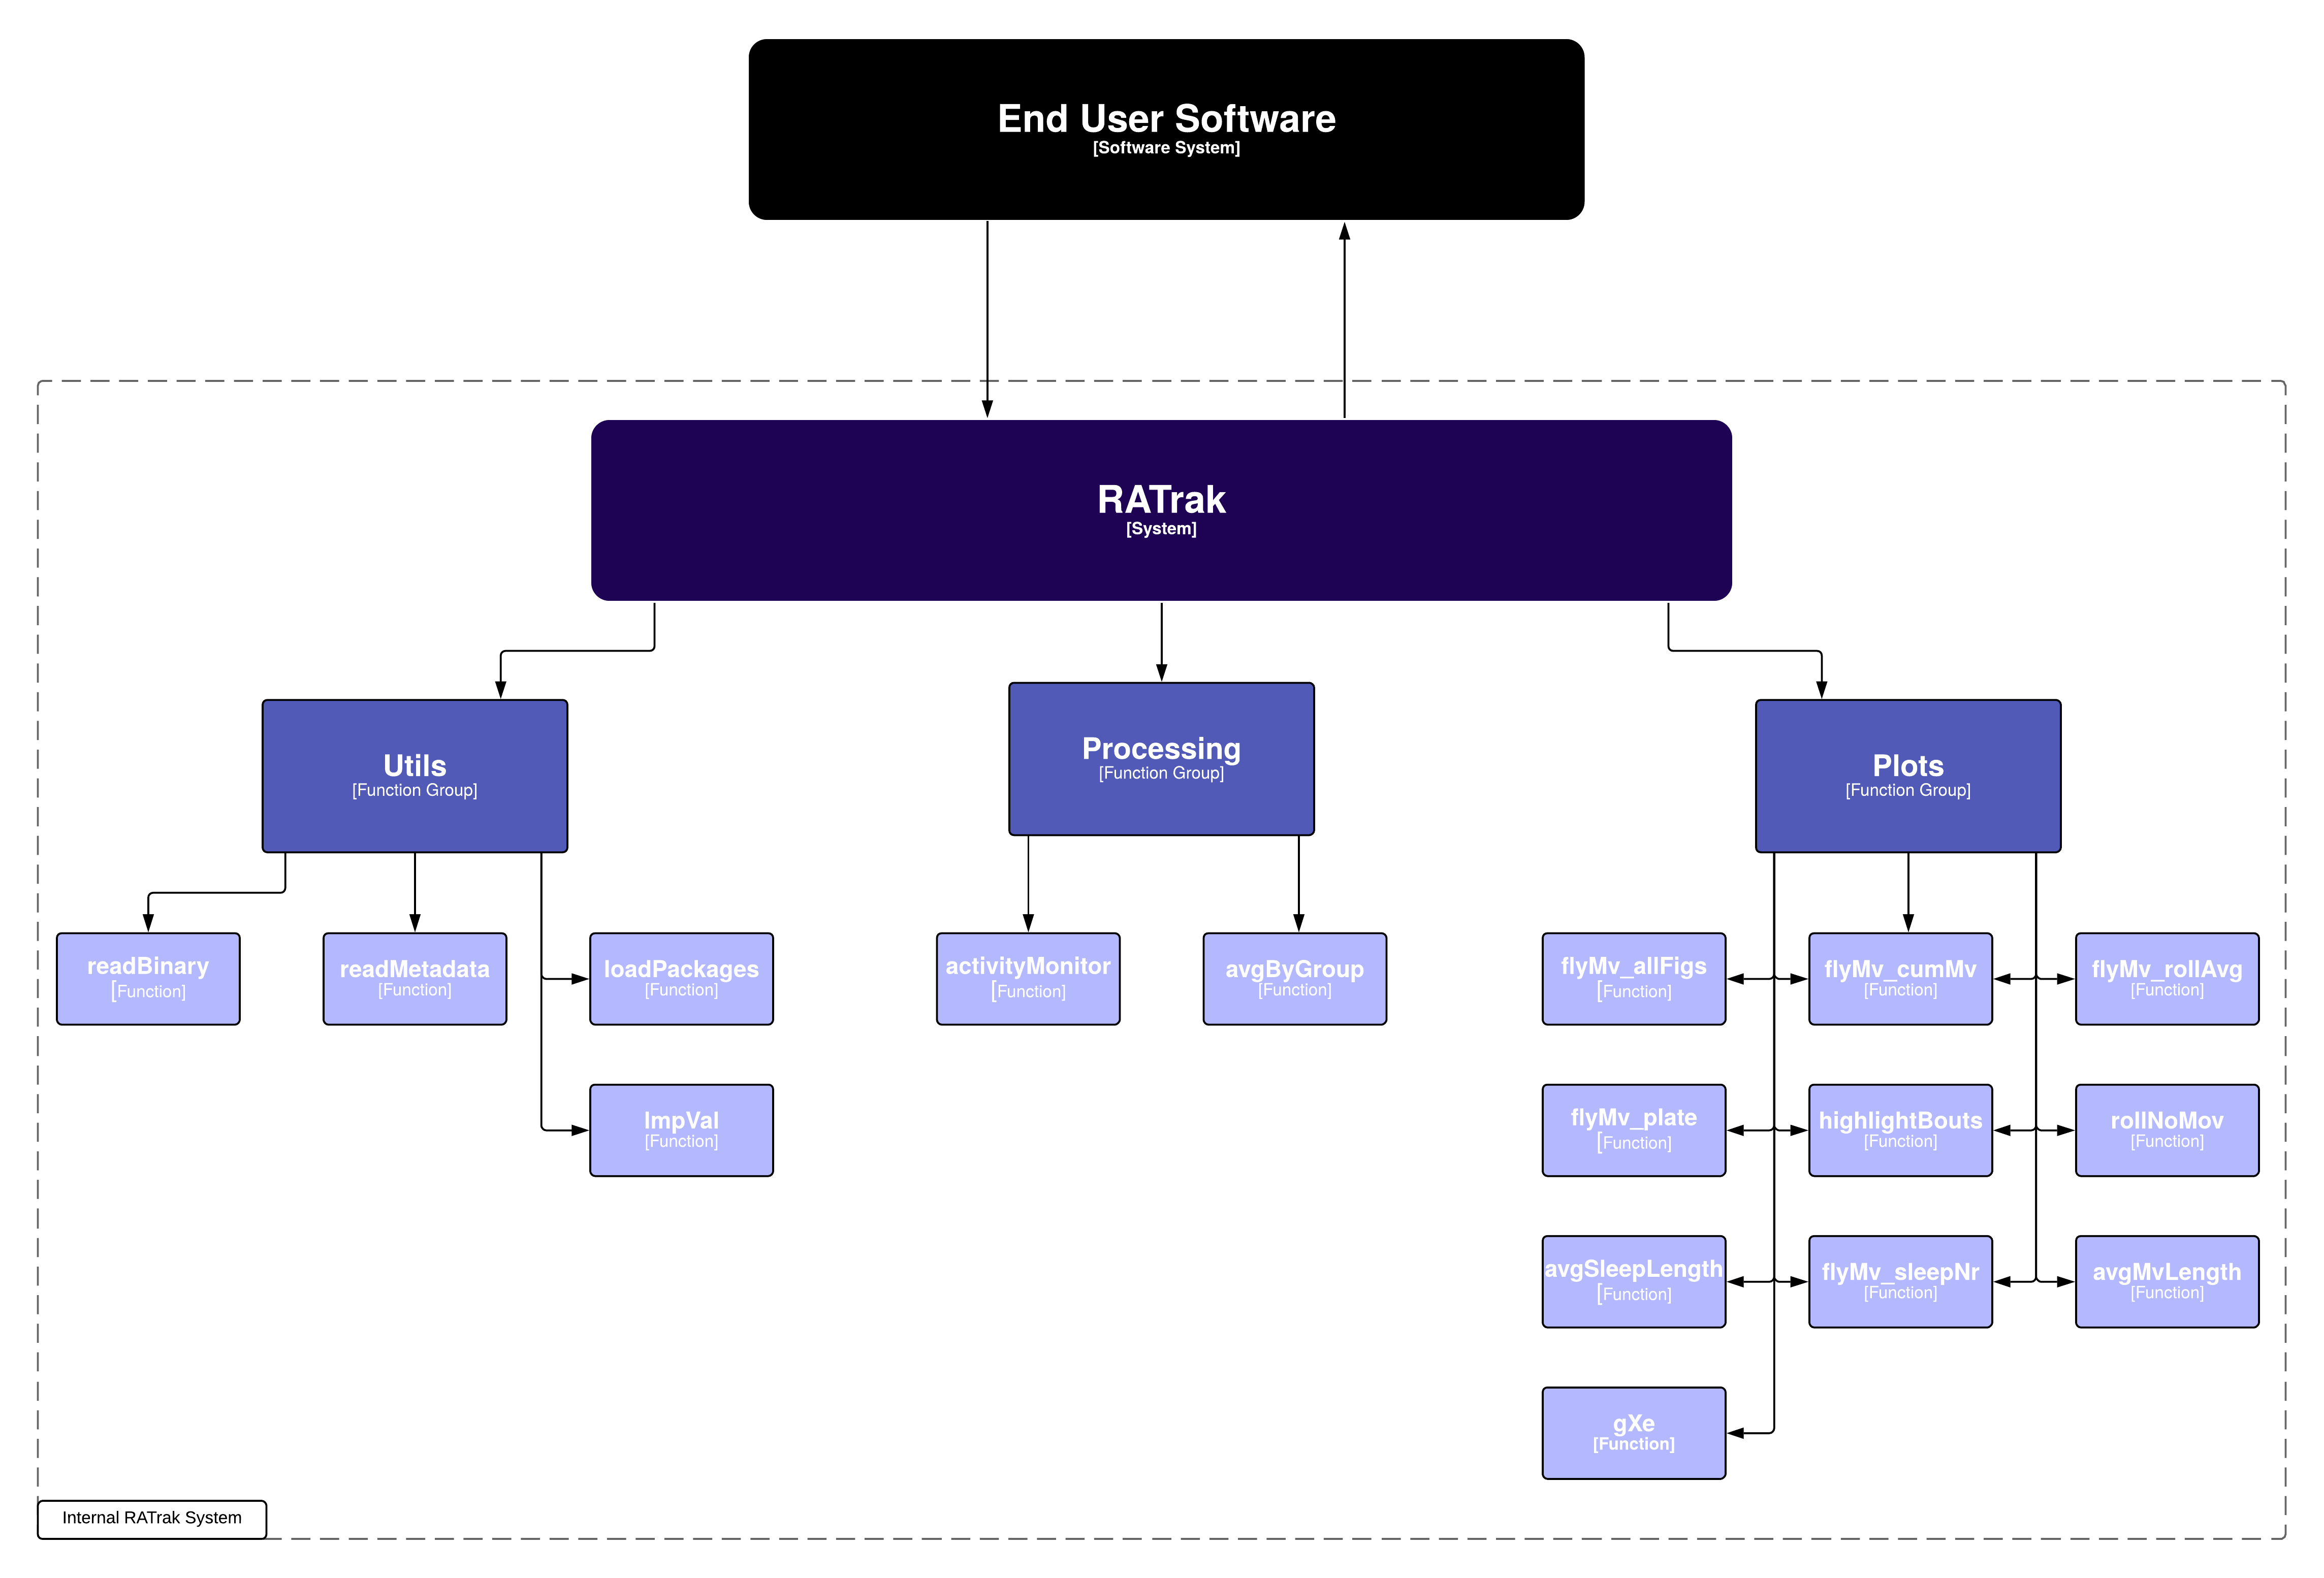
RATrak
Drosophila melanogaster locomotor patterns provide keen insights into the molecular and genetic structures that control complex behavioral patterns. Furthermore, many of the movement characteristics and regulators identified in Drosophila, including many related to psychostimulants and environmental adaptation, can be translated to mammals. Fortunately, with the advent of modern computer vision applications, recording locomotor activity is a relatively simple endeavor and can be used to generate valuable datasets quickly. Up until now, the packages that provide strong computer vision foundations have lacked user-friendly programmatic interfaces for end users to leverage datasets. In this project, we took on the challenge of providing a generalized R package to facilitate the investigation of these novel datasets. Working specifically with locomotor data collected from high-throughput assays in which flies are tracked in segregated arenas, the RATrak package provides users with a suite of structured analysis functions and visualization tools for probing their datasets. Along with the software suite, we present, in a separate repository, a newly developed feeding assay to complement the package and allow for simultaneous measurement of locomotion and food consumption.
To see some examples of the code in use, see the project’s resources folder or examples below.
Structure
Example Figures
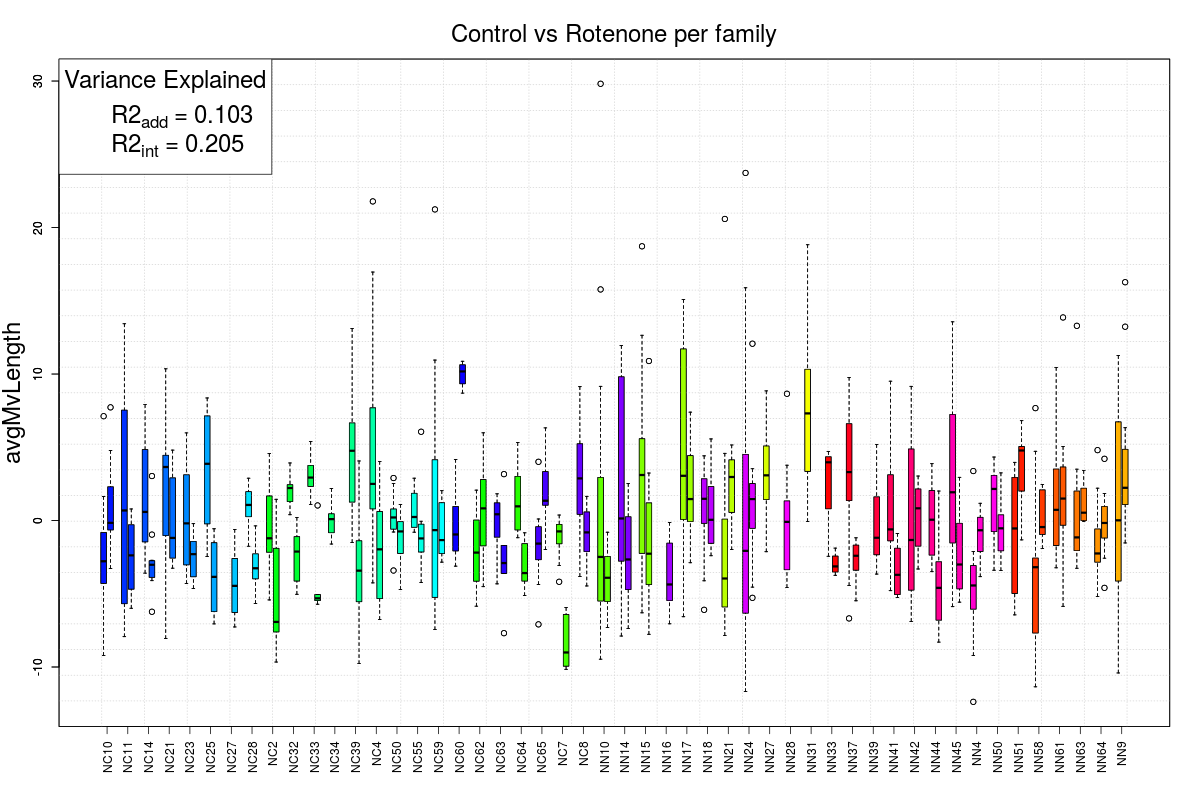
GxE Box Plot
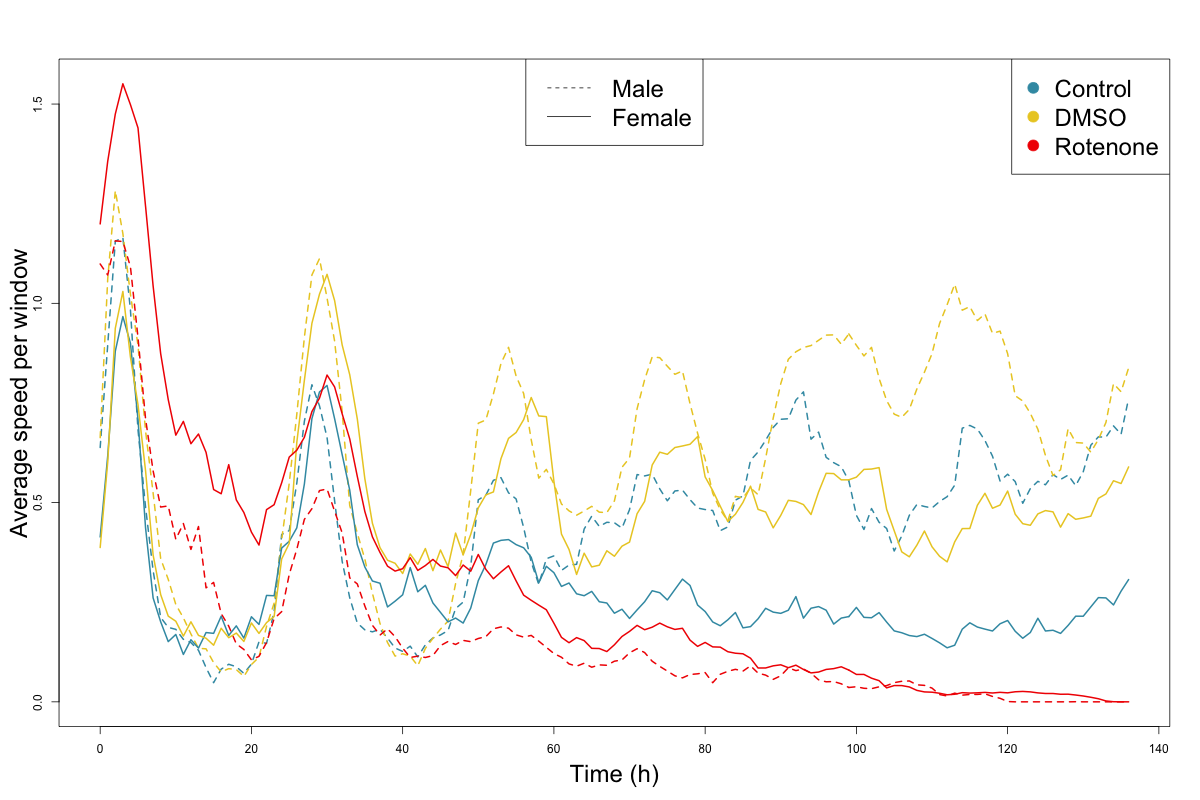
Grouped Speed
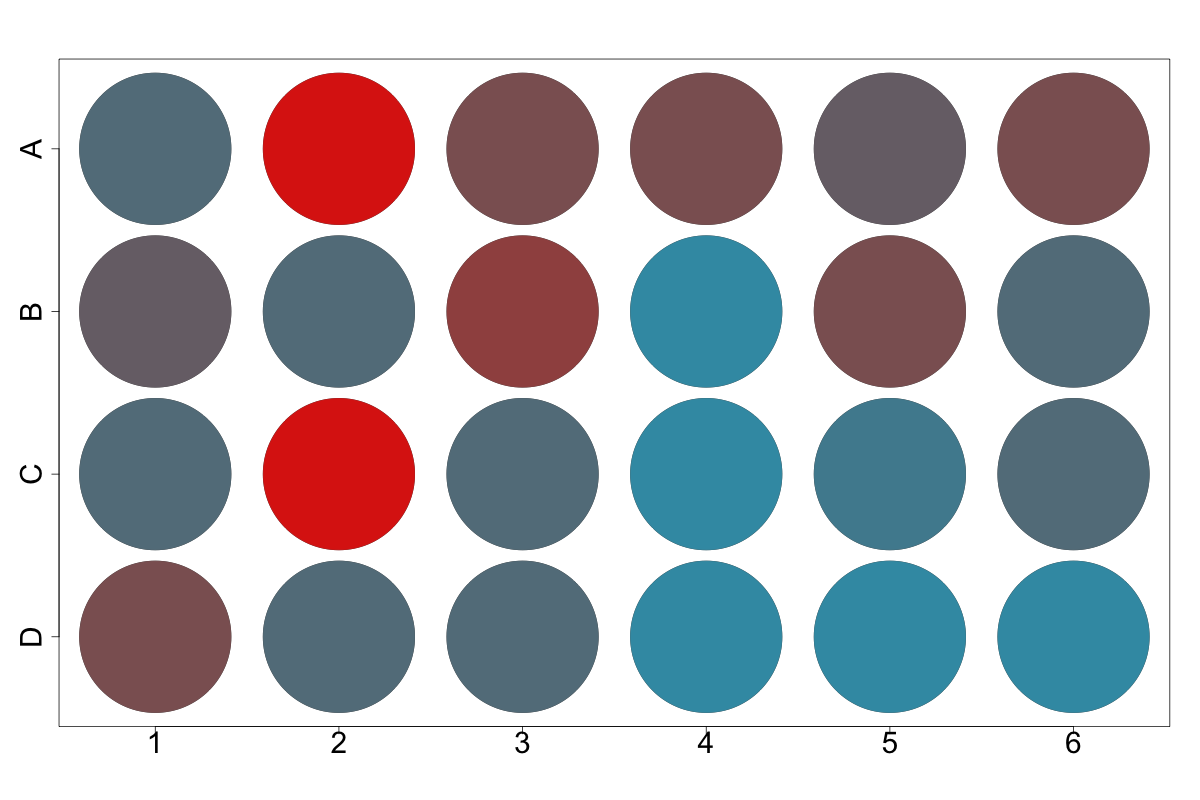
Well Plot
Installation
install.packages("devtools")
library(devtools)
install_github("wolfffff/RATrak")
Sample code
#Read binary data into matrix with given colCount - only take in column 1:10
speed <- readBinary("05-19-2018-19-13-19_Speed.bin", 144,1, 10)

#Read manually created "info" csv containing metadata
metadata <- readMetadata("info.csv")

#Using only first 10
sex <- metadata$Male[1:10]
treatments <- metadata$Treatment[1:10]

#Grouping
groupedInfo = flies.avgByGroup(speed, sex, treatments)

#Calculating activity
activity <- flies.sleepActivity(groupedInfo$speed)

#Plotting all
plot.flyMv_allFigs(speed, activity, "Name", sex = groupedInfo$sex, treatments = groupedInfo$treatments, noMv= T)
More sample code to come...
Contributing
- Fork it
- Create your feature branch (
git checkout -b my-new-feature) - Commit your changes (
git commit -am 'Add some feature') - Push to the branch (
git push origin my-new-feature) - Create new PR